

R&D vs. Marketing: How Technical Storytelling brings your engineers and the Executive Committee together
Your 6-point checklist
You know this scene.
On one side of the table are you and your team of engineers. They have just spent 18 months optimizing a new system or refining a revolutionary optical design. They are proud. They project a complex CAD file, a dense technical drawing, or a 300-line Excel spreadsheet. It is precise and technical.
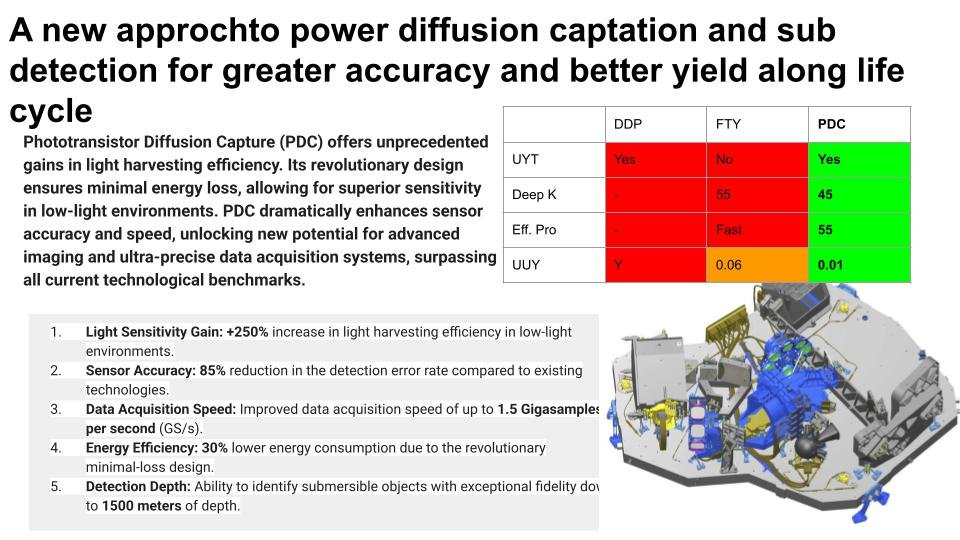
This is a fake slide created for illustrative purposes.
It accurately represents the starting point for projects.
On the other side, the Comex, investors, and marketing. They squint. They see numbers, complexity, and somewhat dubious 3D (unfortunately, they recently saw Avatar).
They don't see the value. Someone ends up asking the painful question:"
"
And you know you're going to have to work hard.
This "perception gap" is one of the main reasons why innovative projects fail or have their budgets cut. It is not a technology issue.
It is a translation issue.
The solution is not to "simplify" (which insults the engineer) or to "make it look pretty" (which does not fool the investor). The solution is Technical Storytelling.
What is Technical Storytelling?
Technical Storytelling is the art of translating complex engineering data into strategic visual assets.
It's more than just 3D or video: it's the missing link between function (what the product does) andemotion (what the user feels). It brings a project's raison d'être to life long before it leaves the factory, transporting the viewer into a future where the problem has already been solved. It's a cousin of advertising.
Unlike traditional marketing design, which seeks to seduce, Technical Storytelling seeks to make people feel innovation.

Rather than saying that their reactor is "fast" and "safe," Stellaria has chosen to bring it to life through a simulator.
In 3 minutes, turn on the reactor and see for yourself the natural physical phenomenon that extinguishes itself.
Why your CAD files fail to convince the Executive Committee
As an Innovation Director or Founder, you know that your native files (SolidWorks, CATIA) are manufacturing tools, not communication tools, unless you spend a lot of time refining them. Here are the main obstacles:
Cognitive abstraction: A 2D or 3D plan requires intense mental effort to be understood as a finished product. An investor and their analysts may not have the time or imagination to do so.
The absence of humans: A prototype on a gray background is a still life. Without seeing human interaction, it is impossible to imagine how it will be used or to appreciate its benefits. We don't know how big it is or what it fits into.
Focus on "How" vs. "Why": CAD shows how it's done (screws, flows). Decision-makers want to see why it's important (space savings, safety, speed, power).
The 3 Levels of Visual Maturity in Industry
At Spatial Nick, we evaluate innovative companies based on their visual maturity.
Where do you stand?
| Level & Visual | Objectives & Opportunities | Impact & Benefits | Your Role |
|---|---|---|---|
|
Level 1: Technique
CAD captures, 2D drawings, Excel
|
Objective
To have a basic visual to "show that it exists."
Opportunities
1st Investor Meeting
Innovation Competition
Internal Budget
|
Low Impact
|
Founder |
|
Level 2: Aesthetics
3D rendering with white background, Photoshop retouching
|
Objective
Present the vision and how it works to investors and clients.
Opportunities
Product Launch
B2B Sales
Trade Show
|
Medium Impact
|
Founder CEO CMO Product Manager |
|
Level 3: Strategic
Technical Storytelling
Photorealistic Video in Context, Immersive VR, Real-Time App |
Objective
Bring the vision to life, demonstrate the societal and technological impact.
Opportunities
RDV 2+ Investor
"Submarine" mode release
Strategic Partnerships
|
High Impact
|
VP Innovation CEO CTO Director of Innovation |
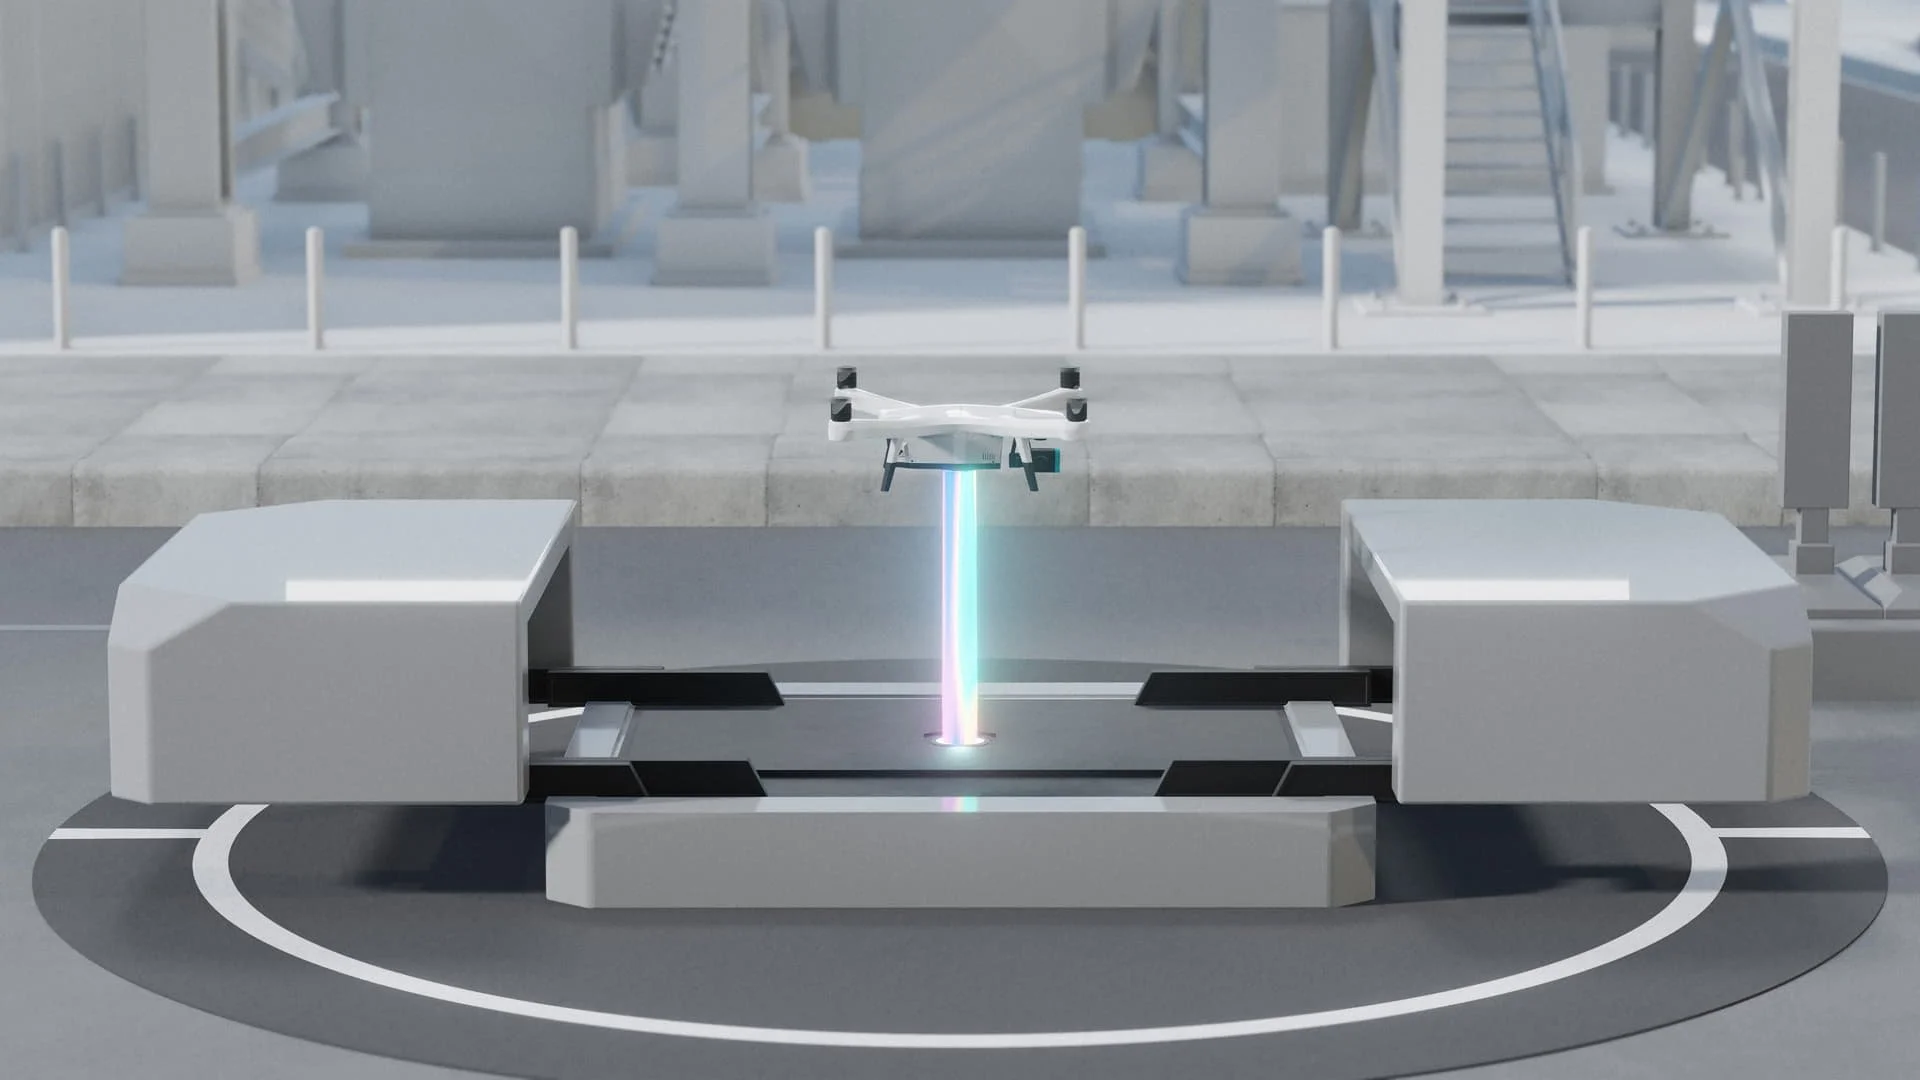
Case Study: Iris Lab – Making the invisible visible

The Iris Lab project perfectly illustrates this challenge. How do you sell an innovation that, by definition, is difficult to perceive or highly technical?
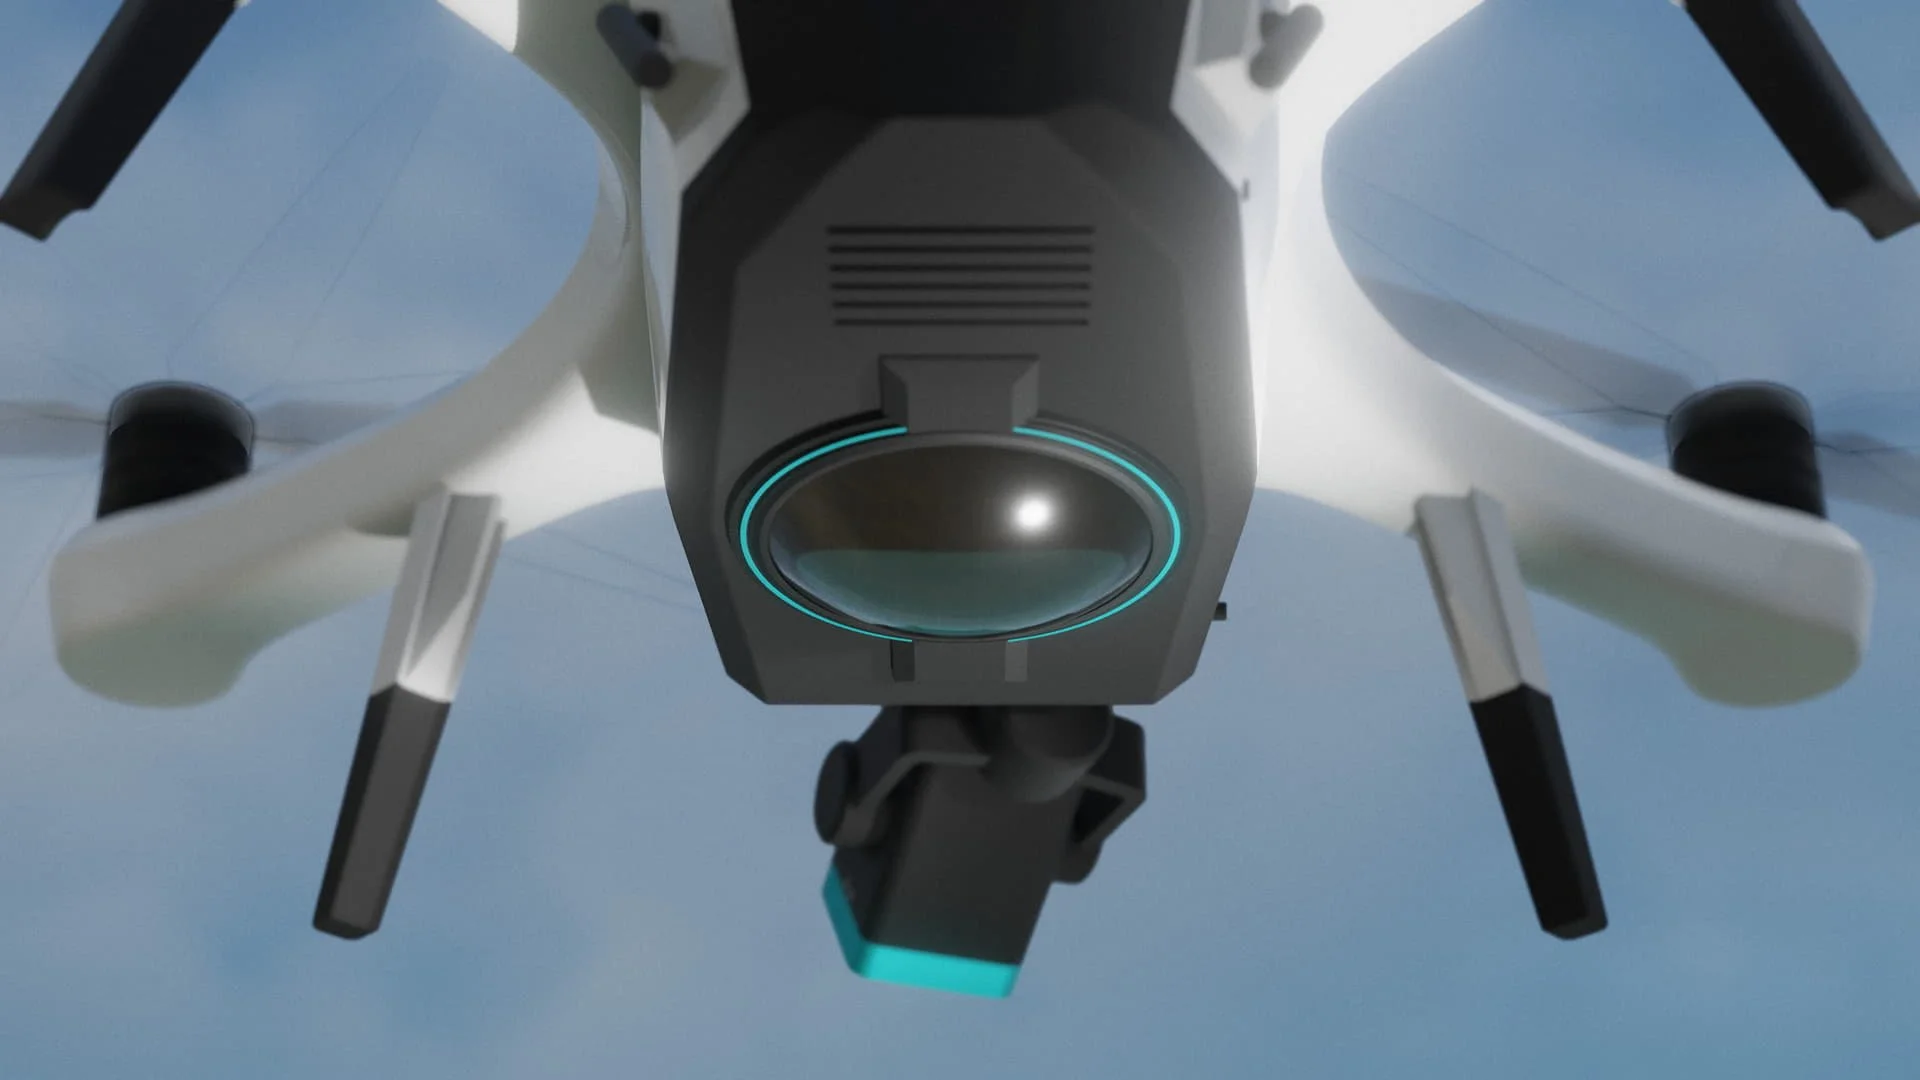
The Challenge: The Iris Lab team was developing laser-powered drone technology. It was essential to avoid trivial questions weighing down meetings with venture capitalists or potential clients. Spending 15 minutes talking about technical details out of a 30-minute Q&A session is completely counterproductive. They needed to instantly convey the added value and practical use of the solution to non-expert partners.
The Spatial Approach Nick: We didn't try to simplify the technology, but rather to contextualize it.
Usage Scenario: Rather than showing the product in isolation, we integrated it into its actual usage environment.
Visualizing the Invisible: We used 3D technology to materialize the laser, which is invisible to the naked eye, thereby demonstrating the power and safety of the system.
Emotion through Detail: By working on textures and lighting, we transformed a laboratory concept into a tangible, simple, and credible product.
The Result: The visuals instantly lent credibility to the project, facilitating discussions with investors and partners by removing the friction of "technical misunderstanding."
3 Tips to Improve Your Visuals Today (Without Calling Us)
You don't necessarily need an external studio to take your first steps toward technical storytelling. Here are three simple actions to try with your teams:
The 5-Second Test: Show your main slide (the one with the technical diagram) to someone from HR or Accounting. Hide it after 10 seconds. Ask them, "What is this? What is it used for?" If the answer is vague, your visual is too complex.
Add a Human Scale: Always add a silhouette or a hand (even a rough sketch) to your CAD screenshots. This allows the brain to instantly understand the size of the object, which is the first anchor to reality.
The "Before/After" Rule: Don't just show your solution. Show the current state (the problem) alongside your solution (the future). The reptilian brain of decision-makers loves contrast. It's the simplest form of storytelling.
Your Technical Storytelling Checklist
Are you preparing a fundraising campaign or a Comex presentation? Make sure your presentation includes at least 3 of these 6 essential visual assets to reassure investors about your hardware project.
The good news is that you can produce them yourself with relatively few resources: with AI, 3D software, or simply by editing in PowerPoint.
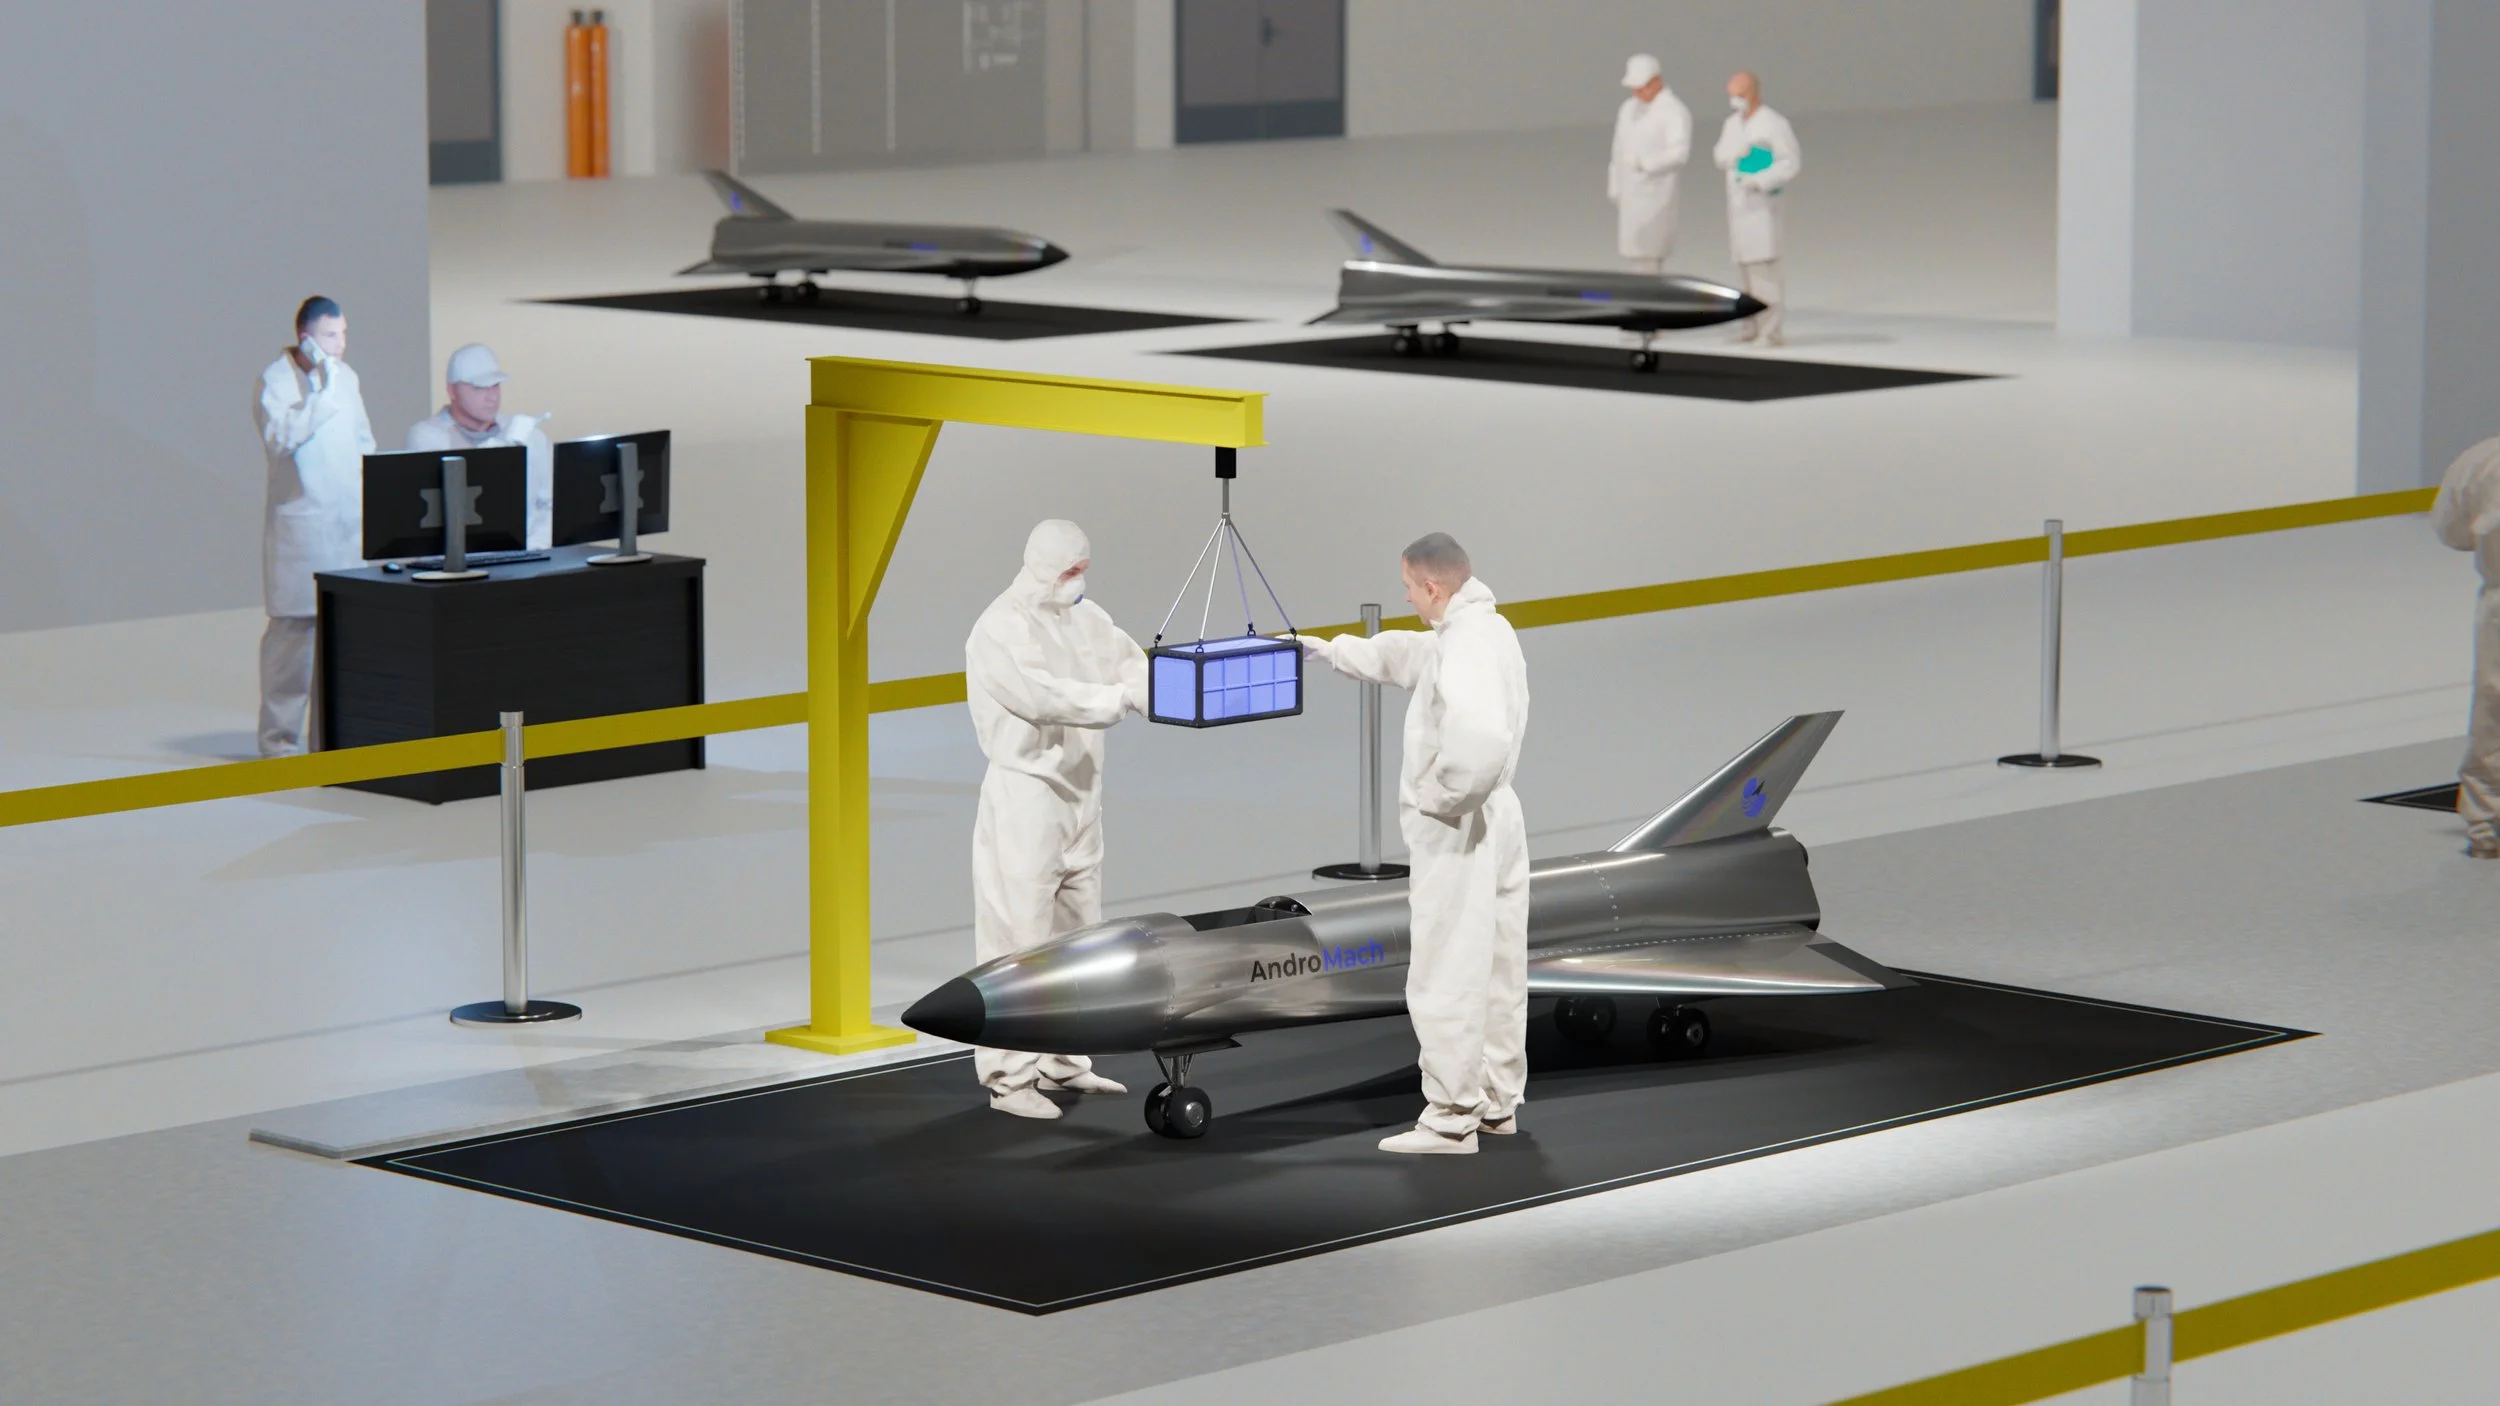
The Contextual "Hero Shot"
An image of your product in its final environment (not on a white background).
Why? It shows that you understand your market and are planning ahead.

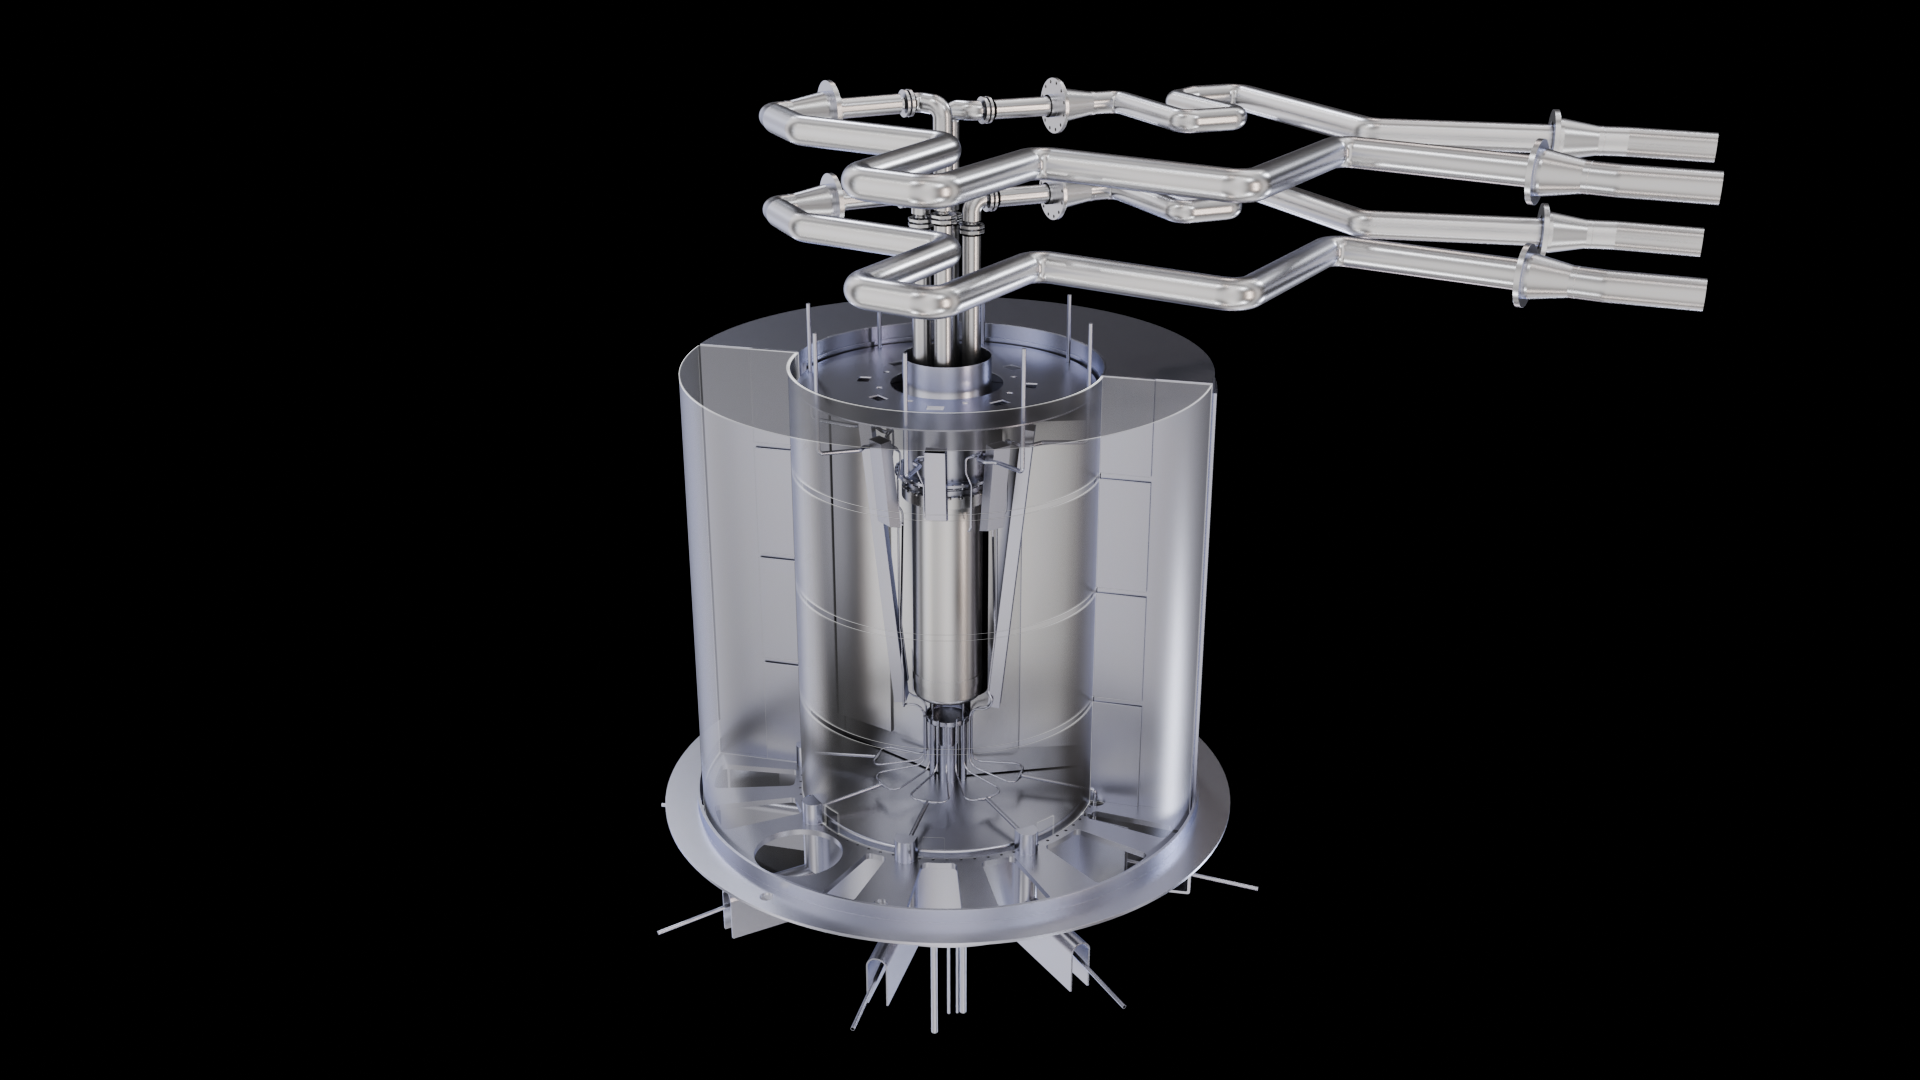
Cross-section view / Exploded view
An exploded view showing the "heart" of the innovation (motor, chip, mechanism).
Why? It demonstrates your attention to detail and enhances technical credibility.
Packaging / Logistics
An image of the product packaged, on a pallet, or being installed
Why? Reassure them about industrialization, distribution, and volume capacity.
Scale Comparison
The product placed next to a familiar object (person, phone, coin).
Why? It eliminates any ambiguity about physical size.

The Flow Chart
A simplified visualization showing what is flowing (data, energy, fluids).
Why? Explain the added value that is invisible to the naked eye.

The Visual Roadmap
A timeline showing the visual evolution from prototype V1 and V2 to the final product.
Why? It shows the team's speed and ability to project themselves forward.
Want to turn your CAD files into strategic assets?
Contact us for a quick assessment of your current assets.